


In the world of financial markets—whether stocks, forex, or cryptocurrencies—technical indicators serve as essential tools for traders aiming to predict price movements and refine their strategies. These mathematical calculations, based on price, volume, or open interest, are used to identify trends, reversals, and momentum. While no indicator is infallible, a solid understanding of technical indicators can significantly improve a trader’s edge.

In this article, we’ll dive into the most effective types of technical indicators, explore how they work, and discuss how to combine them for optimal trading performance.
What Are Technical Indicators?
Technical indicators are statistical tools used to analyze past market data and forecast future price action. They are typically overlaid on price charts or displayed in a separate pane beneath the chart. Unlike fundamental analysis, which focuses on company performance or macroeconomic data, technical indicators strictly evaluate market behavior.
Traders use technical indicators for several purposes:
- Trend Identification
- Momentum Analysis
- Volatility Measurement
- Buy/Sell Signal Generation
- Confirmation of Price Movements
Types of Technical Indicators
Technical indicators are generally categorized into four primary groups: trend-following, momentum, volatility, and volume-based indicators.
1. Trend Indicators
These help traders identify the direction of market movement.
- Moving Averages (MA): The most commonly used indicator. Simple (SMA) and Exponential (EMA) moving averages smooth out price data to highlight trends.
- Moving Average Convergence Divergence (MACD): Combines moving averages to show changes in momentum and direction.
- Average Directional Index (ADX): Measures the strength of a trend, regardless of direction.
Use Case: A trader might go long when the 50-day MA crosses above the 200-day MA (a “Golden Cross”).
2. Momentum Indicators
These measure the speed of price changes and help identify overbought or oversold conditions.
- Relative Strength Index (RSI): Ranges from 0–100; typically, RSI above 70 indicates overbought conditions, below 30 suggests oversold.
- Stochastic Oscillator: Compares closing prices to recent price ranges, useful for spotting divergences.
- Rate of Change (ROC): Calculates the percentage change in price over a specified period.
Use Case: If the RSI is above 70 and a bearish candlestick forms, it may signal a reversal.
3. Volatility Indicators
These show the magnitude of price fluctuations over time.
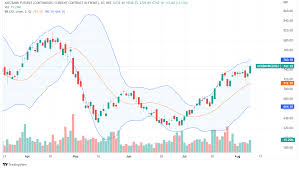
- Bollinger Bands: Consist of a moving average and two standard deviation lines. When price touches or breaks the bands, it may suggest an upcoming reversal or breakout.
- Average True Range (ATR): Measures market volatility by analyzing the range between high and low prices.
Use Case: Tightening Bollinger Bands often signal an impending breakout.
4. Volume Indicators
Volume is a key indicator of market strength. High volume often confirms price moves.
- On-Balance Volume (OBV): Tracks cumulative volume based on whether prices are up or down.
- Chaikin Money Flow (CMF): Combines price and volume to measure buying/selling pressure.
Use Case: If price rises but OBV declines, the move may lack strength, suggesting caution.
How to Combine Technical Indicators
No single indicator offers a complete picture. Smart traders combine indicators to increase the probability of accurate signals:
- Trend + Momentum: Use MACD to identify trend and RSI to time entry.
- Volatility + Volume: Combine ATR with OBV to gauge the intensity of price swings.
- Filter Noise: Multiple indicators can filter out false signals in choppy markets.
Example Strategy: A trader could wait for:
- A bullish MACD crossover (trend),
- RSI below 30 moving upward (momentum),
- Breakout from narrow Bollinger Bands (volatility),
- Rising OBV (volume confirmation).
This multi-indicator setup minimizes false positives and supports a higher-confidence entry.
Common Mistakes to Avoid
While technical indicators are powerful, misusing them can lead to losses:
- Over-Reliance: Indicators should support—not replace—market context and price action.
- Overloading the Chart: Using too many indicators can cause confusion and contradictory signals.
- Ignoring Market News: Major news events can override technical setups.
Tip: Stick to 2–3 indicators that complement each other, and always backtest your strategies.
Conclusion
Mastering technical indicators is vital for any serious trader. Whether you’re swing trading, day trading, or investing long-term, understanding how to apply and interpret these tools can significantly improve your decision-making and timing.
From identifying trends with moving averages to detecting reversals with RSI and confirming volume with OBV, technical indicators provide a data-driven foundation for strategic trading. As with all tools, they work best when combined thoughtfully and aligned with broader market conditions.
By consistently applying technical indicators with discipline and patience, traders can gain an analytical edge in markets that are increasingly fast-paced and data-driven.


